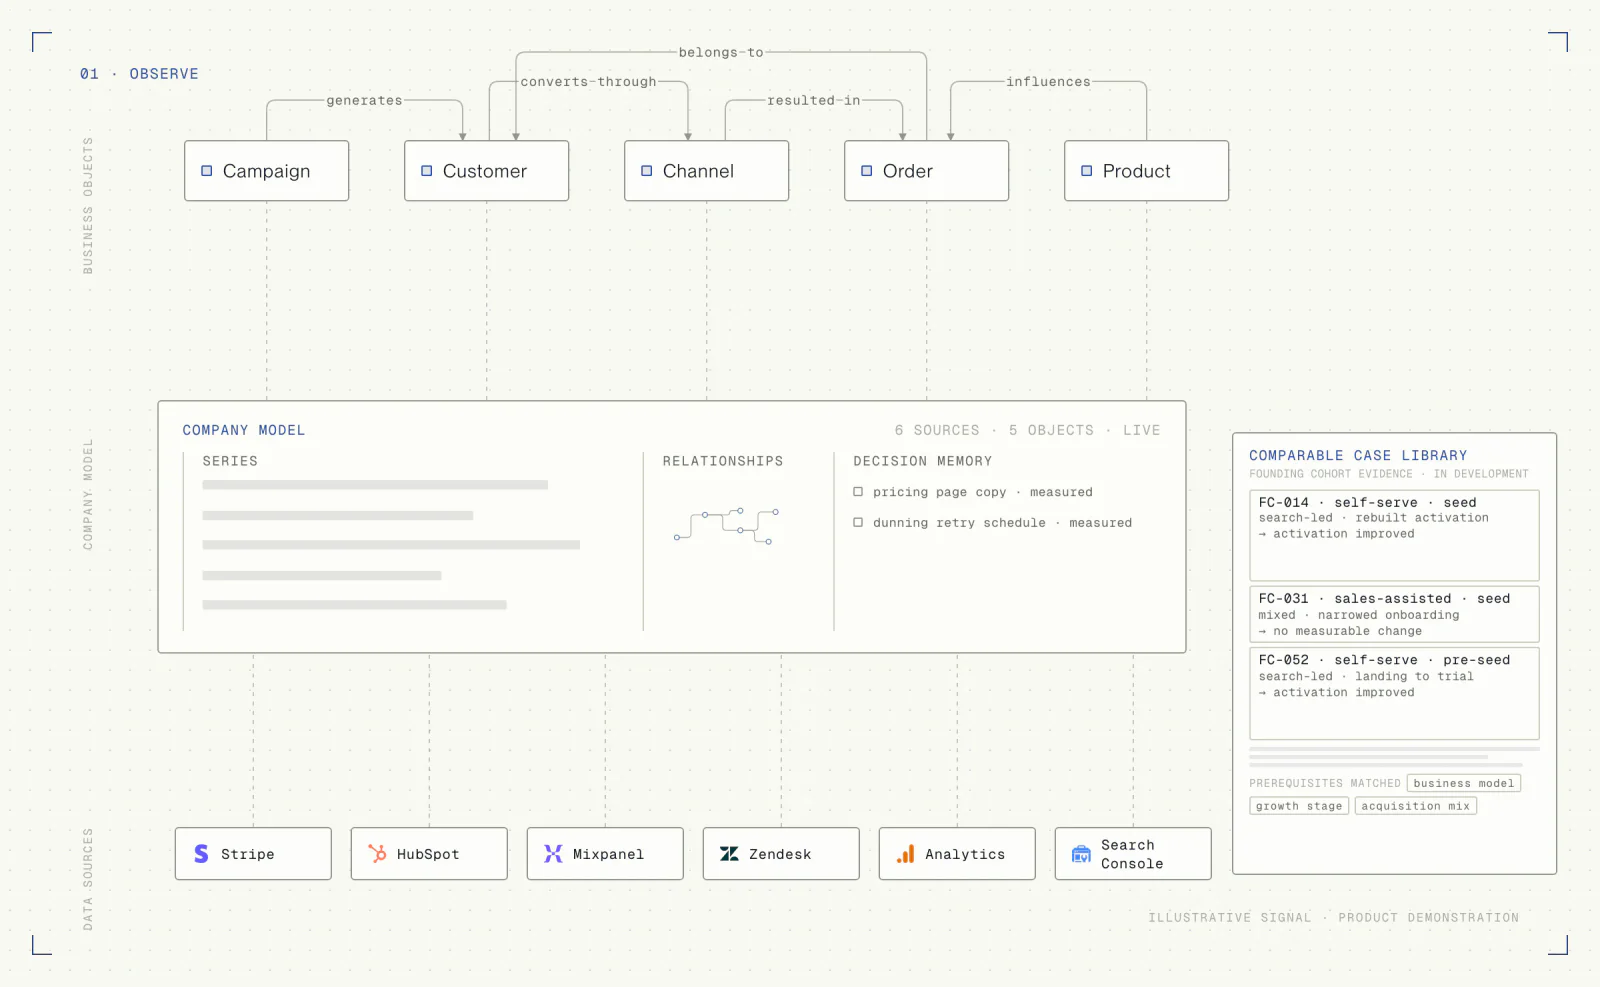
Snapshots
A dashboard is a photograph. It shows you this moment, stripped of history. It cannot tell you what changed last month, what it dragged with it, or whether the dip on the screen is signal or noise.
Tracking infrastructure for early-stage software companies
BayesBrain is tracking infrastructure for early-stage software companies. Every system connected, every metric in context, watched continuously with statistical discipline.
BayesBrain connects operational data, identifies meaningful changes, turns them into decisions, and learns from every measured outcome.
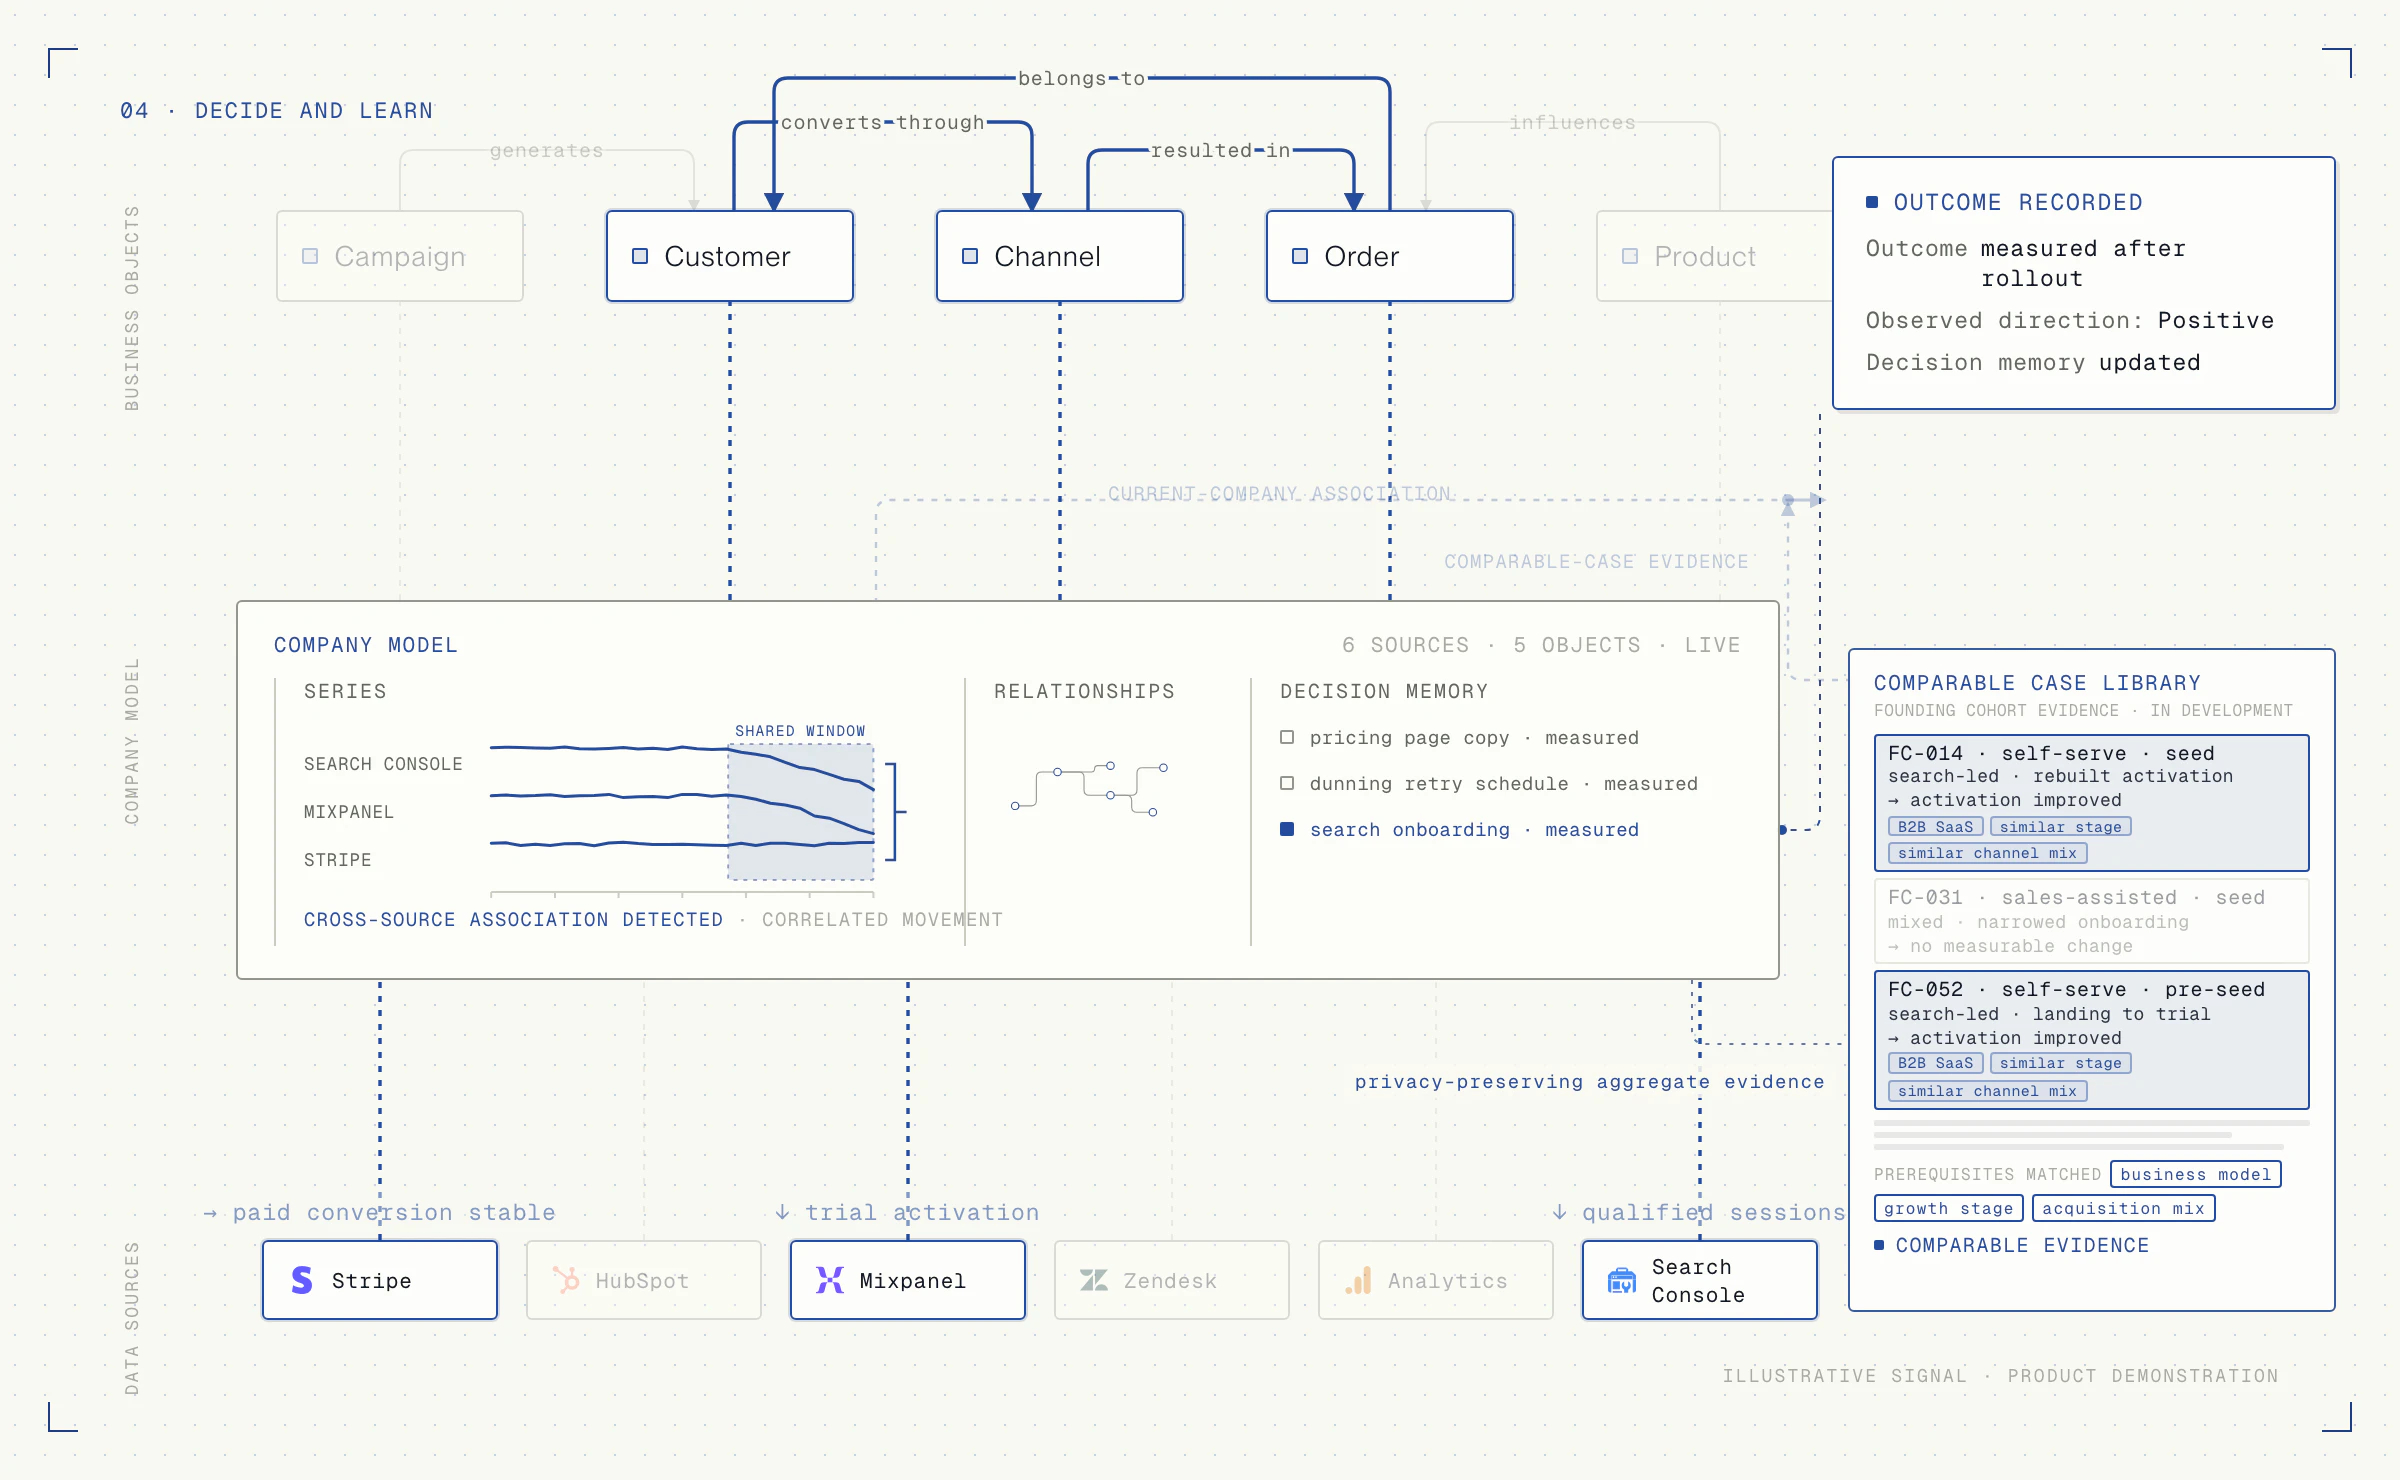
A dashboard is a photograph. It shows you this moment, stripped of history. It cannot tell you what changed last month, what it dragged with it, or whether the dip on the screen is signal or noise.
Revenue in one tab. Costs in another. Traffic in a third. Nothing in your stack knows the others exist. Right now, the only integration between your tools is you.
Ask an AI about your business and it starts from zero every time. Pasted spreadsheets, screenshots, context that expires the moment the chat ends. Rented context decays. Owned context compounds.
Thousands of companies run the same experiments: pricing, channels, hires. Each one learns from a sample of one, and the lessons die inside the company. What actually works is knowable. It is just never shared.
Thomas Bayes. Portrait of contested authenticity.
BayesBrain's engine is statistical inference, not machine learning. Detection is frequentist: trend tests corrected for autocorrelation, false discovery control across every series, and a materiality floor so only changes that are both real and large enough to matter surface. Measurement and memory are Bayesian: beliefs about what works start wide, and every observed outcome narrows them. The prior becomes the posterior, and the posterior becomes the next prior. The system does not get opinions. It gets evidence.
A rank-based test for whether a series is trending rather than wandering. It compares every reading with every later one and counts how often it rose against how often it fell, so it assumes no particular distribution and a single freak week cannot manufacture a trend.
Business metrics carry over week to week, so consecutive readings are not independent evidence. Left uncorrected that inflates significance and a flat series starts producing findings. The test's variance is corrected for the series' own serial correlation, which lowers the effective sample size to what the data actually supports.
Testing many metrics at once means some will look significant by chance alone. Rather than one threshold per test, the p-values are ranked together and the cut is placed so that only a small expected share of what we report is a false alarm.
Statistically real is not the same as worth your attention. A change also has to clear a size that matters for your business before it is written up, which is what keeps a technically significant but trivial move out of the brief.
An estimate starts from a prior drawn from comparable cases and is revised as your own data arrives. Early on the estimate leans on the prior and says so; as your evidence accumulates it takes over, and the stated uncertainty narrows with it.
FIG. 01 · BAYESIAN UPDATING